
Bitcoin's $74K Support: The Trend-Defining Battle
Bitcoin traders are monitoring the critical $74,000-$75,000 support zone as exchange inflows rise and selling pressure increases following BTC's pullback from $82,000. Crypto analyst Ardi suggests the next retest of this range could be the most important support test of the current bear market.
FinCNews Editorial
View source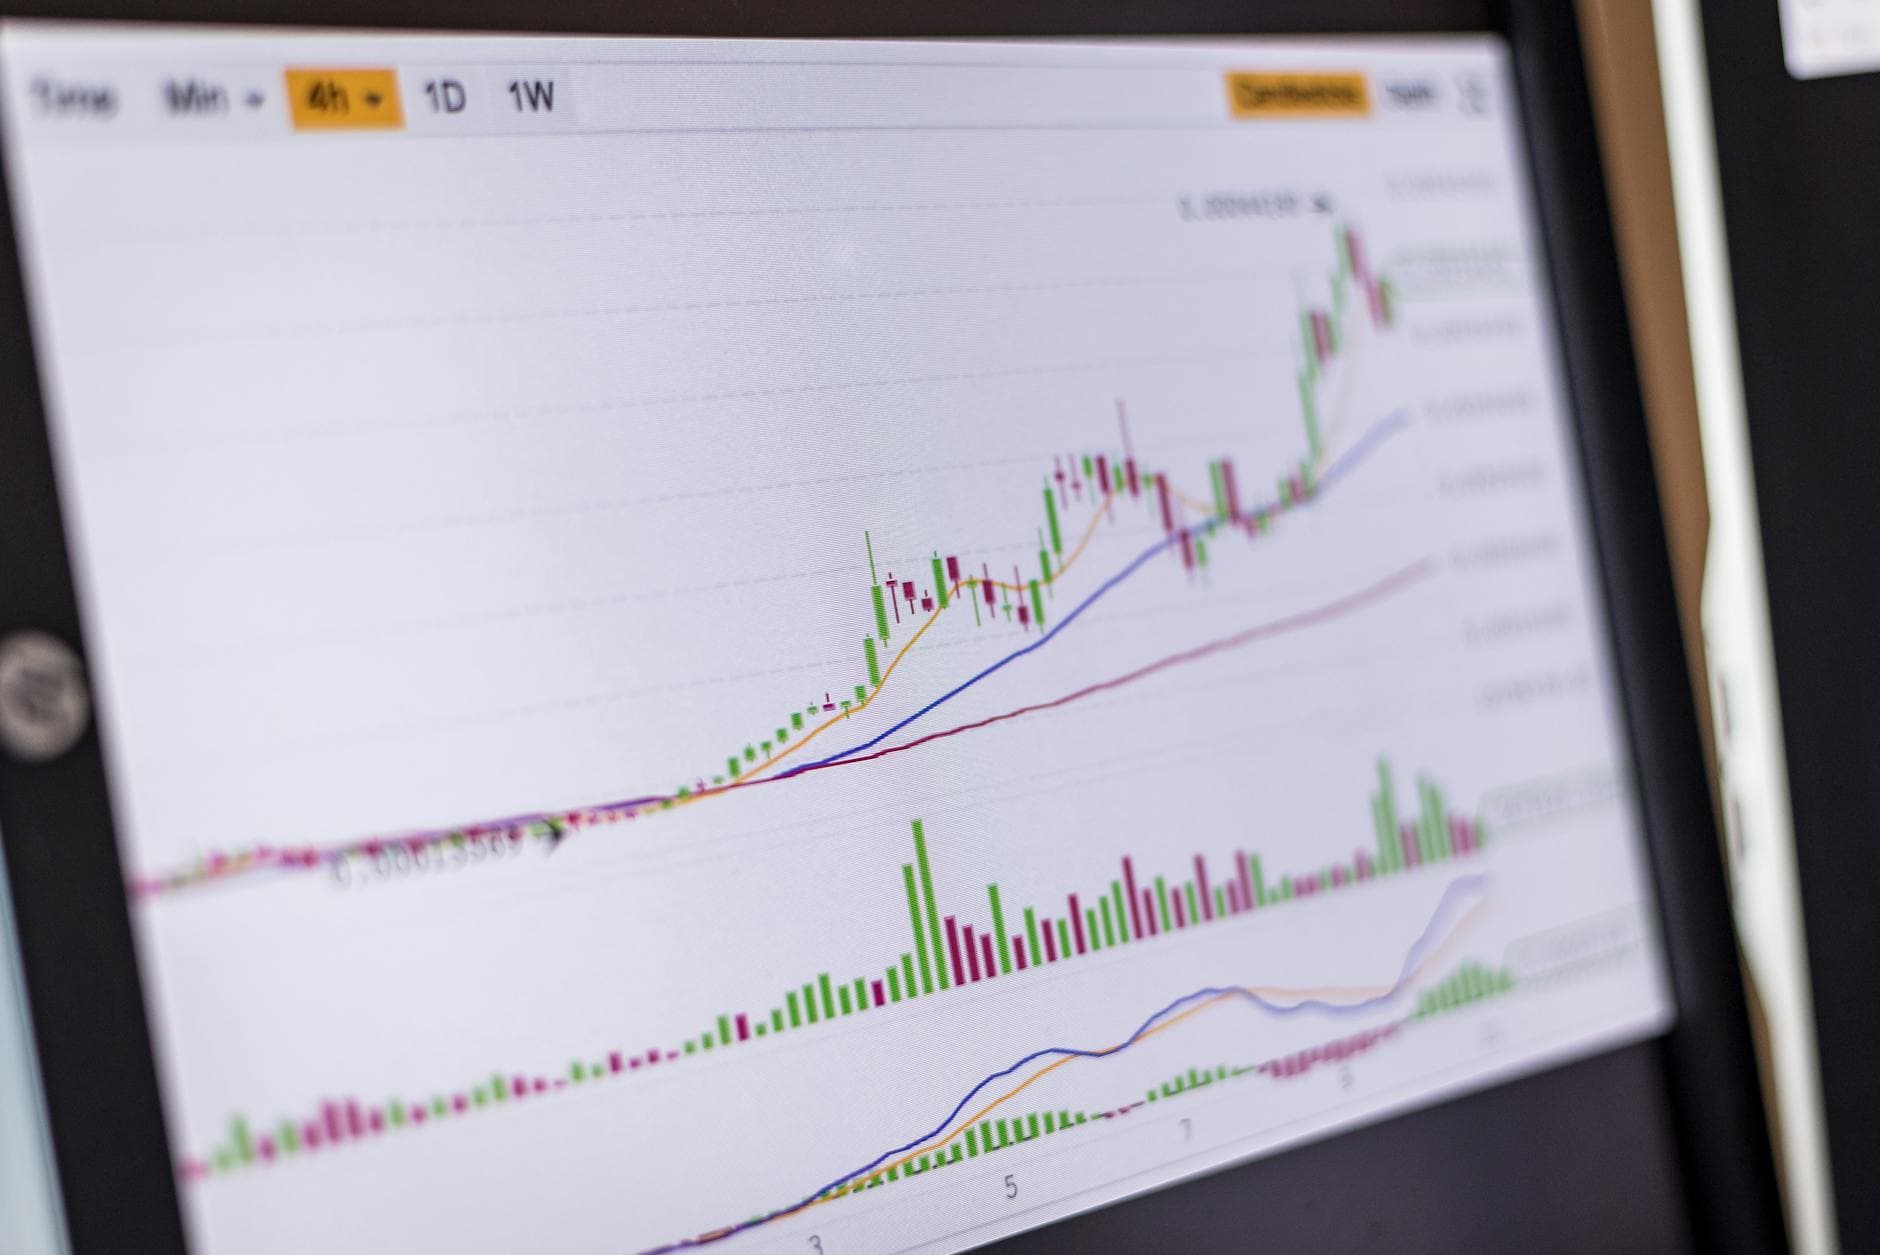
What Happened
Bitcoin lost its hold on the $80,000 level over the weekend, with BTC trading around $77,346 as of May 18, 2026. Exchange inflows have increased while market momentum weakened following the cryptocurrency's failure to sustain gains above $82,000. Traders are now intensely focused on the $74,000-$75,000 support zone, which has served as a critical price floor repeatedly over the past two years.
Crypto analyst Ardi identified this support range as potentially the most important test of the current bear market cycle. The analyst highlighted the historical significance of the $74,000-$75,000 zone, noting its repeated role in defining Bitcoin's price action since 2024. In 2024, Bitcoin consolidated for seven months while struggling to break decisively above this range. Subsequently, in Q1 2025, the same area held as support before BTC rallied toward its cycle highs at $126,000.
Why It Matters
The $74,000-$75,000 support zone represents more than technical resistance—it is a price level that has consistently determined Bitcoin's directional bias over multiple market cycles. A breach below this level could trigger further downside momentum, while a successful hold would reinforce the bull case established by the $126,000 cycle highs. For traders and investors, this support test will likely determine whether the current pullback is a healthy correction or the beginning of a more significant reversal.
Rising exchange inflows during this period add urgency to the situation. Historically, increased exchange inflows can precede selling pressure, as they represent movement of Bitcoin from self-custody to trading platforms. Combined with weakening market signals, these dynamics create elevated risk for Bitcoin holders positioned above this support level.
Expert Perspective
Analyst Ardi's assessment reflects a disciplined technical analysis approach grounded in historical price action. The identification of $74,000-$75,000 as a trend-defining level is not speculative but rooted in two years of repeated price interactions at this zone. The analyst's observation that this support held during the Q1 2025 rally before enabling BTC to reach $126,000 demonstrates the predictive value of understanding historical support and resistance dynamics. This type of analysis is central to professional trading strategies that identify high-probability reversal or breakdown zones.
What to Watch
Market participants should closely monitor Bitcoin's price action around the $74,000-$75,000 zone in the coming trading sessions. Key signals include whether exchange inflows continue accelerating, changes in trading volume at this support level, and Bitcoin's ability to form higher lows if it approaches this range. A daily close below $74,000 would signal a critical breakdown, while a rejection and reversal near $75,000 could establish a floor for the current correction. Additionally, traders should watch for correlation shifts with broader equity markets and changes in implied volatility on Bitcoin derivatives, as these often accompany major support or resistance tests.
Not financial advice.
Disclaimer: This article is AI-assisted and for informational purposes only. Nothing published on FinCNews constitutes financial advice, investment recommendation or solicitation. Cryptocurrency markets are highly volatile. Always conduct your own research and consult a qualified financial advisor before making investment decisions. About our editorial standards →