
Core PCE at 3.12% Keeps the Fed on Hold: What It Means for BTC
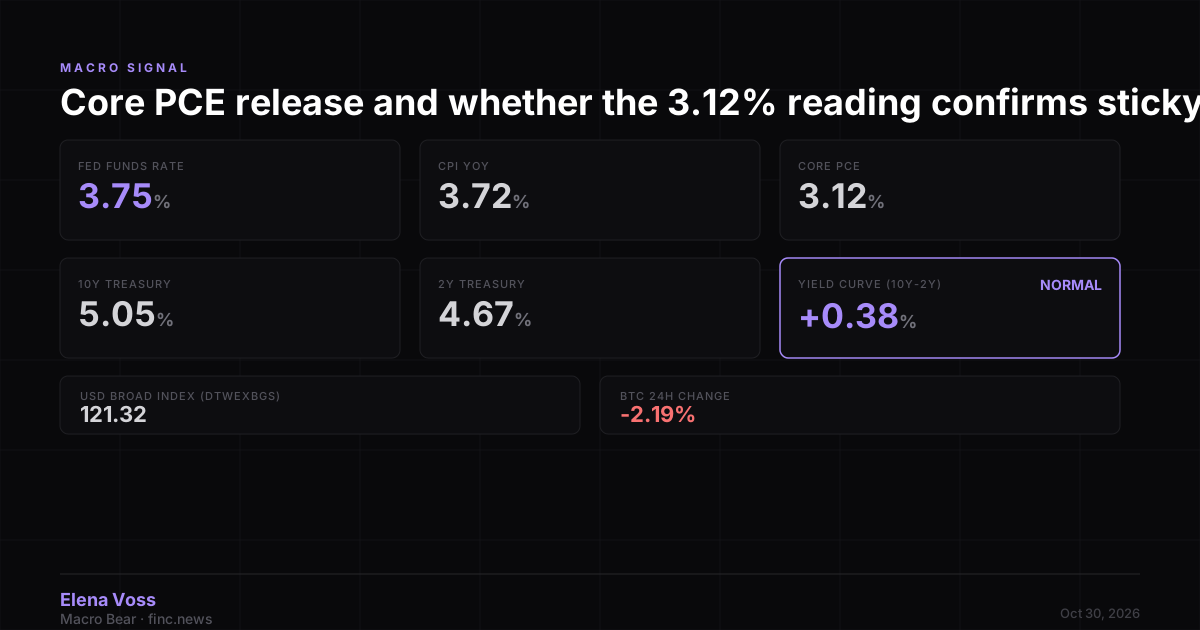
Core PCE printed at 3.12%, above the 3.01% cited in last week's FOMC coverage. With the 10Y at 5.05% and the 10Y-2Y spread at 0.38%, the data points to a longer hold for BTC's macro backdrop.

The Print
Core PCE came in at 3.12116% YoY, against the 3.01% figure cited in our October 29 FOMC coverage. Headline CPI ran at 3.71725%. The Fed Funds Rate sits at 3.75%, and the 10-year Treasury yields 5.05%. Bitcoin is down 2.19% over the last 24 hours.
Where This Sits in the Cycle
The Fed's latest statement, as reported in our prior FOMC piece, held policy at 3.75%. The data available to me does not include the exact wording of today's PCE-related commentary, so I cannot quote a fresh Fed line on this release. What the numbers show is an inflation gauge that has moved up while the policy rate is unchanged. The 10Y-2Y spread at 0.38% remains positive, which means the curve has not inverted, but it is narrow enough to signal limited room for near-term cuts. The USD Broad Index (DTWEXBGS) stands at 121.3202, a level that tightens financial conditions for dollar-denominated risk assets.
Historical Precedent for BTC
Historically, BTC has traded as a risk asset whenever the rate path has been set by inflation rather than growth. During the 2022 hiking cycle, when the Fed moved in 75bp increments and the dollar index climbed toward 105, BTC fell to roughly $20,000 in June of that year. The September 2022 CPI print at 8.3% produced a daily decline of about 10%. The pattern is consistent: hot inflation prints tighten the liquidity backdrop, and crypto has repriced accordingly. The 2024 episode, when January CPI at 3.4% pushed out March cut expectations, follows the same logic. I read today's data as a version of that dynamic, though the magnitude of the current move is far smaller.
Implications for Crypto Positioning
In my view, the data reinforces a higher-for-longer baseline rather than a pivot. The gap between core PCE and the Fed's 2% objective is still wide, and the 10-year at 5.05% keeps the cost of capital elevated across risk assets. The 24-hour BTC decline of 2.19% is consistent with this repricing, though one session is not enough to establish a trend. The data does not resolve whether this move extends. What would change my view is a sustained decline in core PCE toward the Fed's target combined with a steepening curve, neither of which is visible in today's numbers.
What's Next
- 2026-11-06: NFP Release. Watch whether payroll growth confirms a cooling labor market, which would ease pressure on the rate path.
- 2026-11-12: CPI Release. This is the next inflation read. A print that holds near 3.7% headline would keep the hold narrative intact. A move below 3% would be the first signal that the cut path is reopening.
Not financial advice.
Disclaimer: This article is AI-assisted and for informational purposes only. Nothing published on FinCNews constitutes financial advice, investment recommendation or solicitation. Cryptocurrency markets are highly volatile. Always conduct your own research and consult a qualified financial advisor before making investment decisions. About our editorial standards →