
Yield Curve Steepens to 42bps as DXY Hits 121.6: BTC Down 2.5% on Dual Headwinds
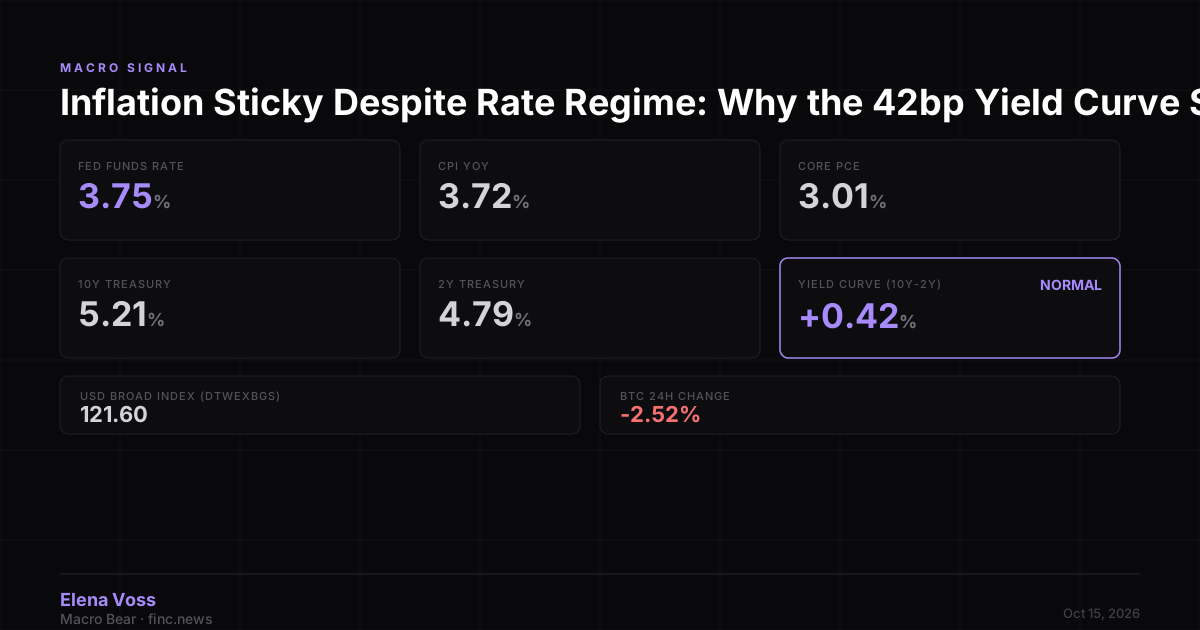
CPI at 3.72% YoY keeps Core PCE above 3.0%, but the real pressure on BTC comes from yield curve normalization and dollar strength—not hike risk.

The Setup
CPI printed 3.72% year-over-year. Core PCE sits at 3.01%. Fed Funds at 3.75%. These are the numbers, but they're not the story. The story is the yield curve spread: 42 basis points (10Y at 5.21%, 2Y at 4.79%)—the widest positive spread since the Fed's cutting cycle began. And the USD Broad Index at 121.6, near multi-year highs. BTC dropped 2.52% in 24 hours. This is not a CPI reaction. It's a liquidity compression signal.
Where We Are in the Cycle
The curve has been normalizing since the Fed's first cut in September 2024 (from 4.75–5.0% to today's 3.75%). That cut came with Core PCE at 2.7%—meaningfully lower than today's 3.01%. The curve was inverted through most of 2023–2024, a classic recession warning. Now it's steepening, but not because growth is accelerating. It's steepening because long-end yields are rising faster than short-end cuts—a sign that inflation expectations are sticky and the market doubts the Fed's ability to return to neutral without reigniting price pressures. Historically, this configuration—steepening curve + strong DXY + sticky inflation—has been toxic for risk assets.
BTC's Precedent in This Regime
In June 2022, the Fed delivered its first 75bp hike. BTC was at $20,000. DXY hit 105. The 10Y–2Y spread was deeply inverted at -50bps. The curve structure was different, but the DXY trajectory was identical: sharply higher. BTC correlated as a pure risk asset. Fast forward: today's DXY at 121.6 is higher than mid-2022 levels, and the curve is no longer inverted—it's confirming that the Fed cannot ease aggressively without inflation consequences. BTC's 2.5% drop mirrors the June 2022 pattern: when the dollar strengthens and long-end yields rise, BTC sells off regardless of CPI headline beats or misses.
What This Means for Crypto Positioning
The dual headwind—curve steepening and DXY strength—matters more than the CPI print itself. A steepening curve signals that markets expect either sustained inflation or a Fed policy error (cutting too soon). A rising DXY drains liquidity from all dollar-denominated risk assets, including BTC. The combination creates a regime where BTC cannot rally on "inflation hedge" narratives because the dollar is appreciating, and it cannot rally on "rate cut" hopes because long-end yields are rising. The data doesn't resolve whether this is transient or structural, but the positioning implication is clear: BTC remains sensitive to dollar and yield dynamics, not to crypto-specific catalysts.
What's Next
October 29: FOMC rate decision. Watch the dot plot revision—if the median 2027 terminal rate moves higher, the curve will steepen further. Watch Powell's language on "sufficiently restrictive"—if he hedges, the DXY could consolidate. And watch the 10Y yield: a break above 5.30% would signal that the bond market no longer believes in a soft landing. BTC will trade accordingly.
Disclaimer: This article is AI-assisted and for informational purposes only. Nothing published on FinCNews constitutes financial advice, investment recommendation or solicitation. Cryptocurrency markets are highly volatile. Always conduct your own research and consult a qualified financial advisor before making investment decisions. About our editorial standards →